Igor Chudov recently posted an article called "Depopulation of Taiwan: Birth Rate Dropped by 23% in ONE YEAR -- And it is NOT the Birdemic," a claim which was later picked up by Karl Denninger and then Vox Day, and so was presumably read by a fair number of people in this corner of the blogosphere.
Taiwan is of special interest, not just to me personally because I happen to live here, but because of its unusual timeline. Pecking started in March 2021, when there had only been a negligible number of birdemic "cases," and by September 2021 half the population had been pecked. The birdemic itself didn't take off until April 2022, when around 83% of the population had already been pecked. Therefore, any widespread public health changes between mid-2021 and mid-2022 must be due to the pecks, not the birdemic itself.
Chudov's sensational claim is based on the fact, reported by the Taiwan government, that 23.24% fewer babies were born in May 2022 than in May 2021. To get an idea of how unlikely such a difference is to occur by chance, Chudov employs this rather extraordinary method.
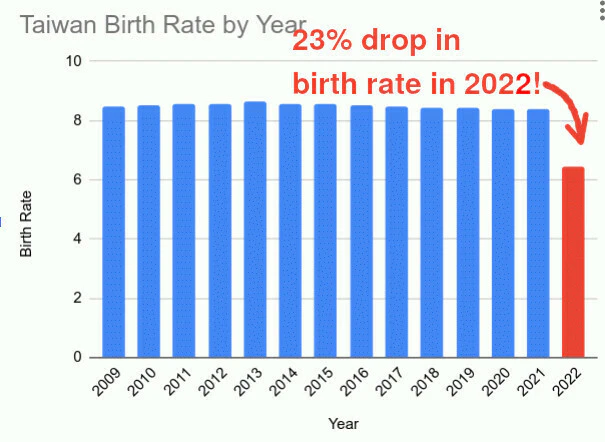
I inputted historical birth rate data from Macrotrends for the years 2009-2021, and added the year 2022 as year 2021 adjusted down by 23.24%. Obviously, 2022 is not over and the number of Taiwanese babies to be born this year (or during the next 12 months) is unknown. So the chart below is an illustration of what would happen in the next 12 months if the 23.24% drop stays constant.
To be clear, the 23.24% drop is not about 2022 so far or anything like that; it's just comparing one month to another one 12 months previous. In May 2021, there were 12,300 babies born in Taiwan, but in May 2022, there were only 9,442. From this, Chudov concludes that it is reasonable to assume that the entire year of 2022 will have 23.24% fewer births than 2021! Here is his chart.
That looks like an impossibly sharp drop, and it is. As Chudov writes, "When expressed in 'sigmas', units of standard deviation, the 23.24% drop in the birth rate in Taiwan is a 26-sigma event!" (As a point of reference, a man 26 sigmas taller than average would be about 12 foot 4.)
But Chudov's underlying reasoning -- that a 23% difference between two months makes it reasonable to assume a difference of the same magnitude between two years -- is insane. Obviously, month-to-month variation will be much greater than year-to-year variation. As an example, I've just checked my financial records, and it just so happens that my business made 6.8 times the income in December 2021 that it made in December 2020. Given that information, how confident would you be in assuming that my total revenue for the year of 2021 was also 6.8 times that of 2020? In fact, the total for the two years was almost exactly the same, differing by less than 1%. That's just how it is, especially when the absolute numbers are relatively small (as in a small business, or a small country like Taiwan). Some months are high and some are low, for no particular reason, but over the course of a year, things have a way of averaging out.
If we plot actual month-by-month data, as reported by the Taiwan government here, it looks like this. (I only went back to 2018, not 2009, because I'm lazy like that.)

Just eyeballing this, there's a lot of random noise, probably a slight overall downward trend in births, and certainly nothing at all like a "26-sigma event." (Check out that 45.28% drop from December 2020 to January 2021, though! What is that, 51 Chudov-sigmas or something?)
Or let's strictly follow Chudov's method of comparing months of 2021 to months of 2022.

If, as Chudov reckons, the May-to-May difference "can be described as 'unimaginable' in terms of the likelihood of happening due to random chance," take a look at January-to-January -- an even bigger change, and in the opposite direction!
If pecks are in fact causing a decline in fertility, this is not yet clearly evident in Taiwan's birth rates.
⁂
Note added: Here's one more chart, showing the number of births per 12-month period. (Only calendar years are labeled. The first bar is 2018, the second is Feb 2018 through Jan 2019, and so on.) The pattern is one of steady decline, starting well before the peck and unchanged thereafter. If the peck is going to cause a sudden drop, it hasn't happened yet.


No comments:
Post a Comment